Charlie Huemmler

[Bio] - [Urban Analytics] - [Advocacy] - [Education]
MUSA Coursework Gallery
MUSA 8000 Practicum
During my Practicum project, my team and I worked with the City of El Paso Capital Improvements Department to construct a latent bus ridership demand model and interactive app. This app enabled them to reconfigure their local bus network to better integrate with the newly constructed Sun Metro bus rapid transit system.
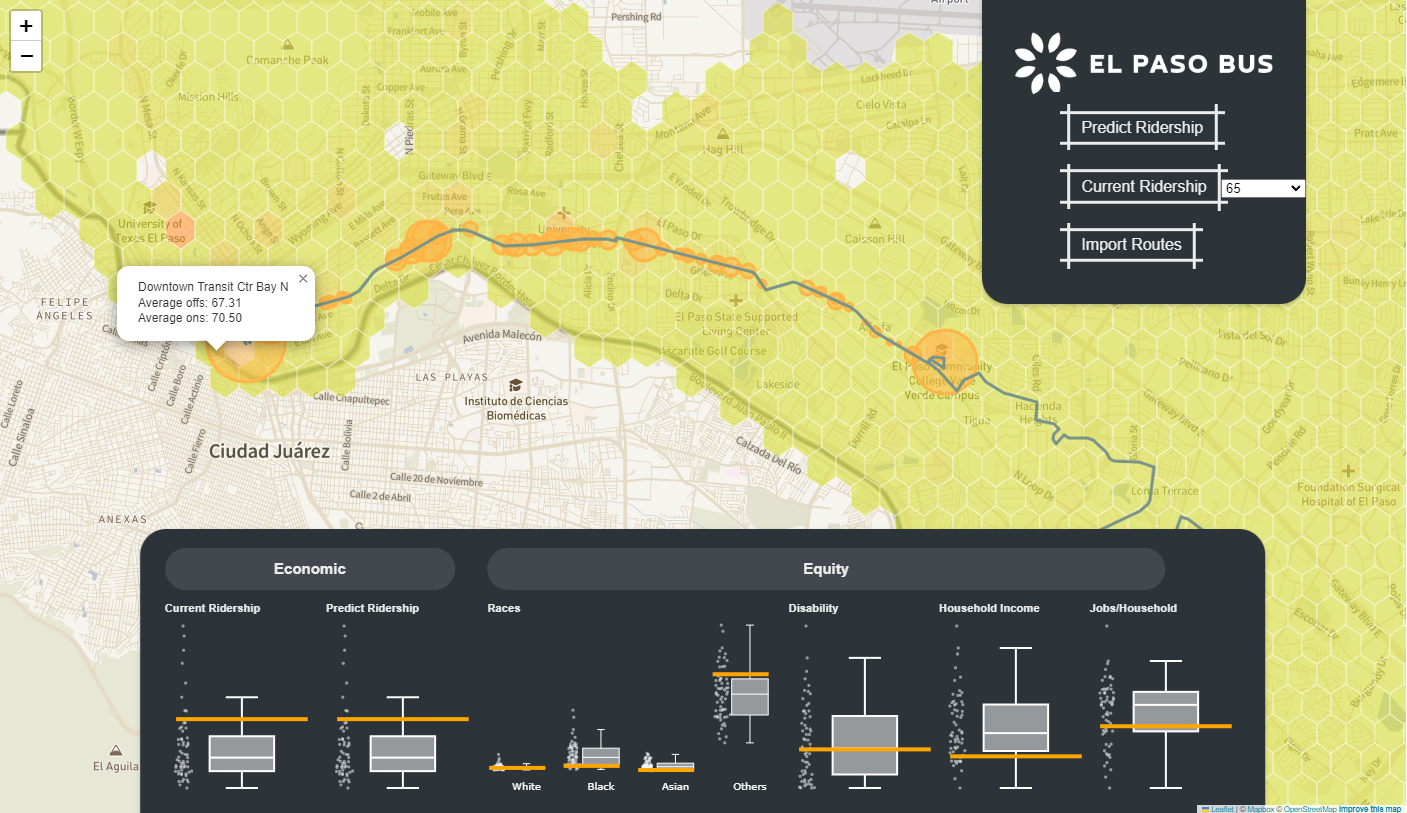
JavaScript Dashboard - Final Presentation - RMarkdown
MUSA 6110 Java Script Programming for Planners and Designers
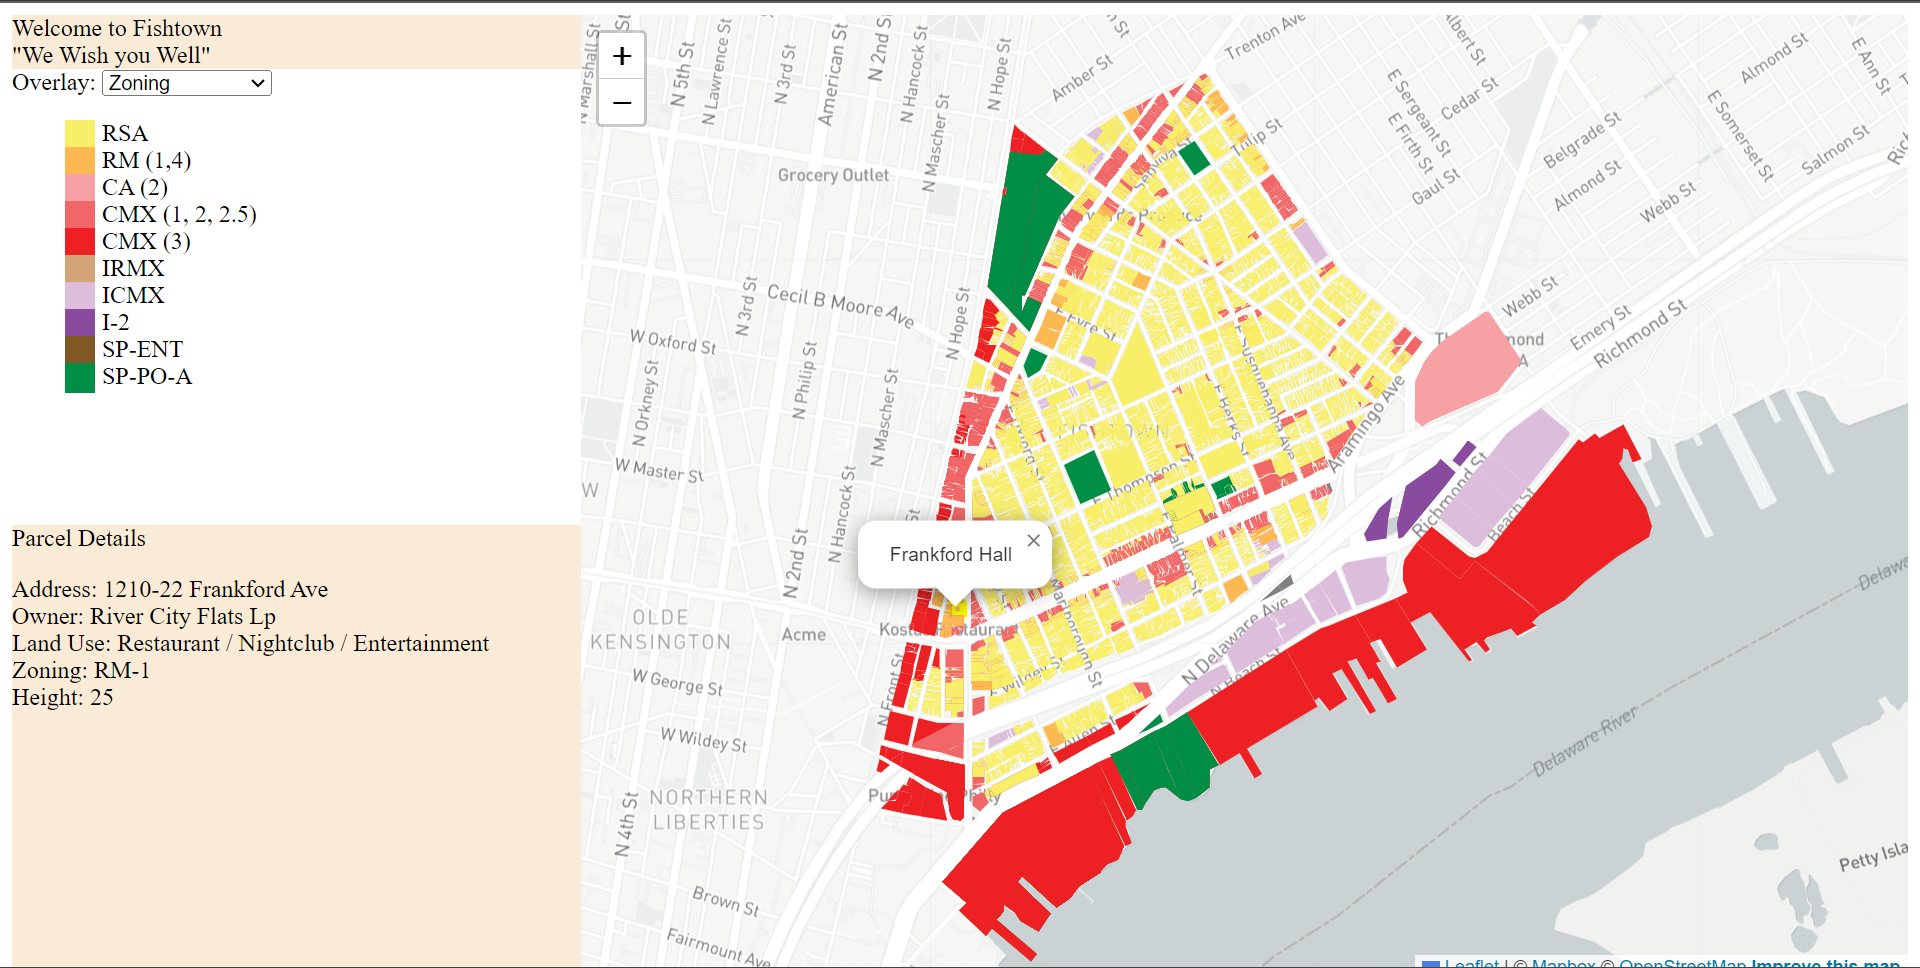
Fishtown Dashboard
For the final project in this course, I built a dashboard displaying housing and land use characteristics of the Fishtown neighborhood, imagining the Fishtown Neighbors Association Zoning Committee as the user. By swapping between the Zoning, Building Height and Commerce overlays, Zoning Committee members can gain relevant parcel level information, helping to facilitate meeting dialogue.
MUSA 5080 Policy Analytics
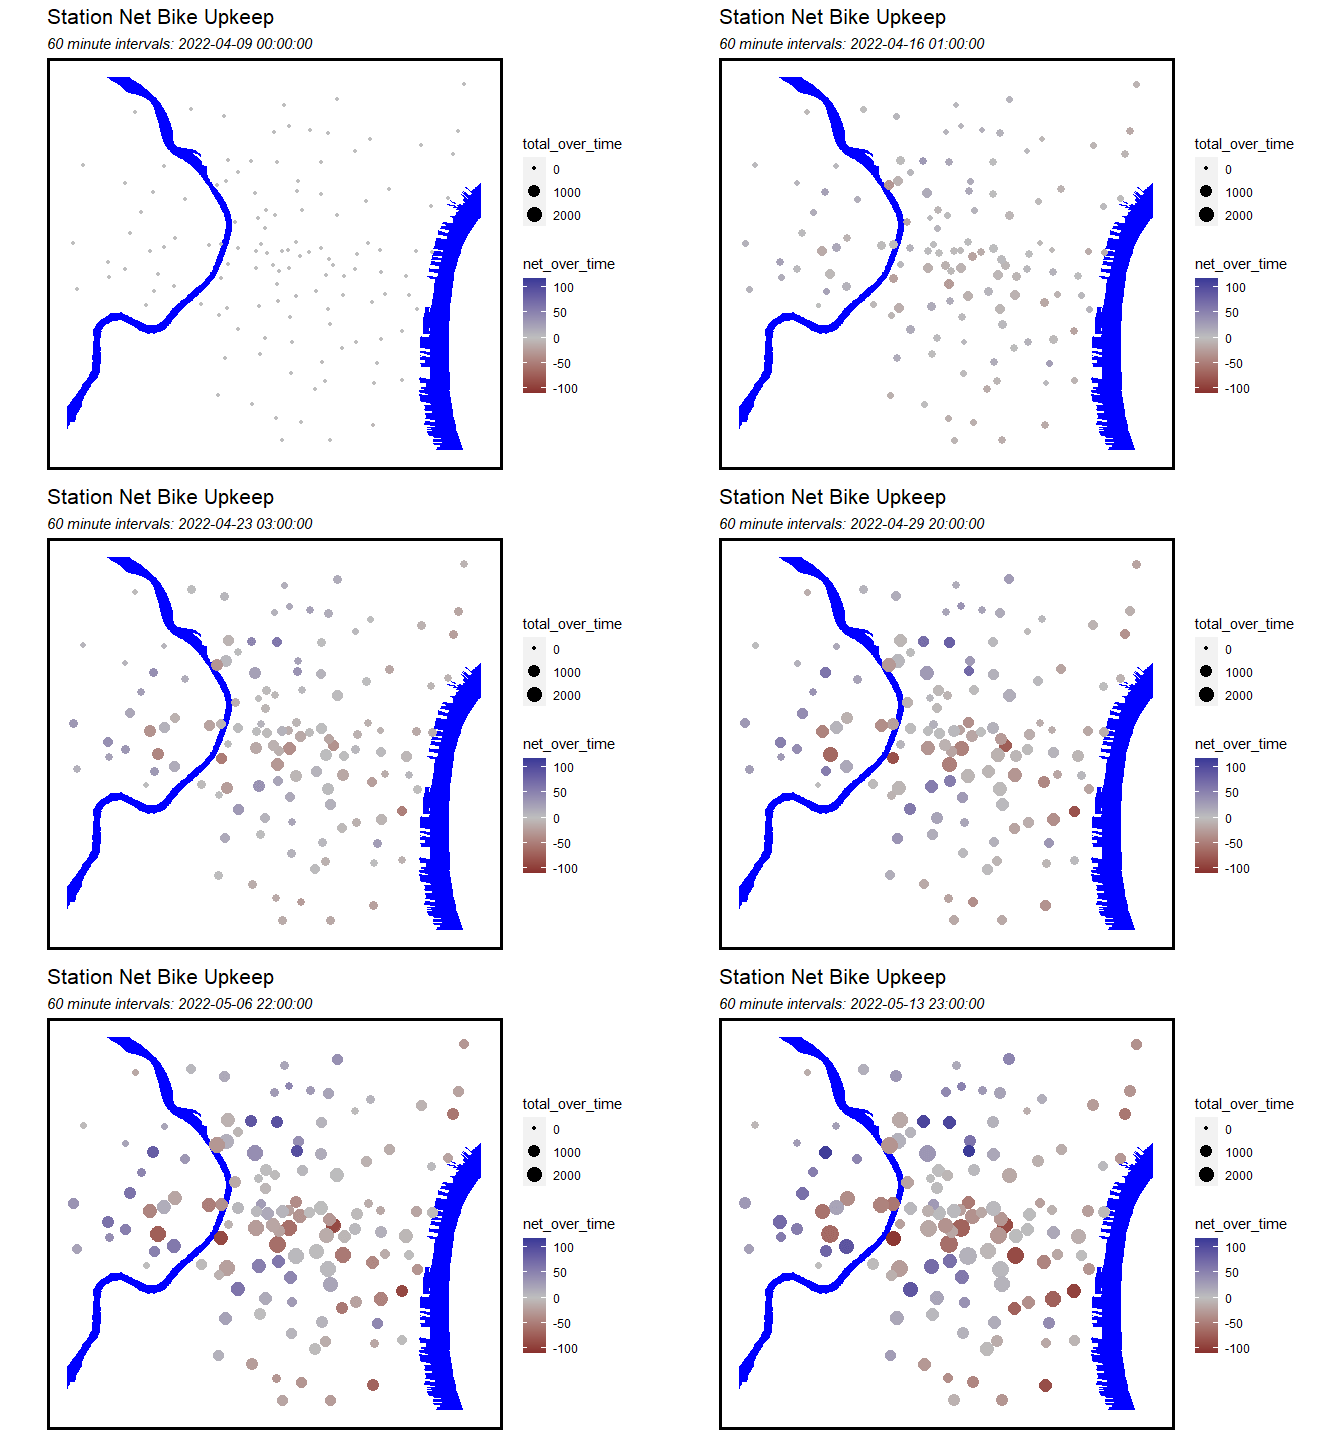
Indego Bike Share Rebalancing Plan
This assignment assists hypothetical Indego operations by predicting when and where Indego stations will be full or empty, allowing the proactive deployment of field technicians to manually rebalance the system.
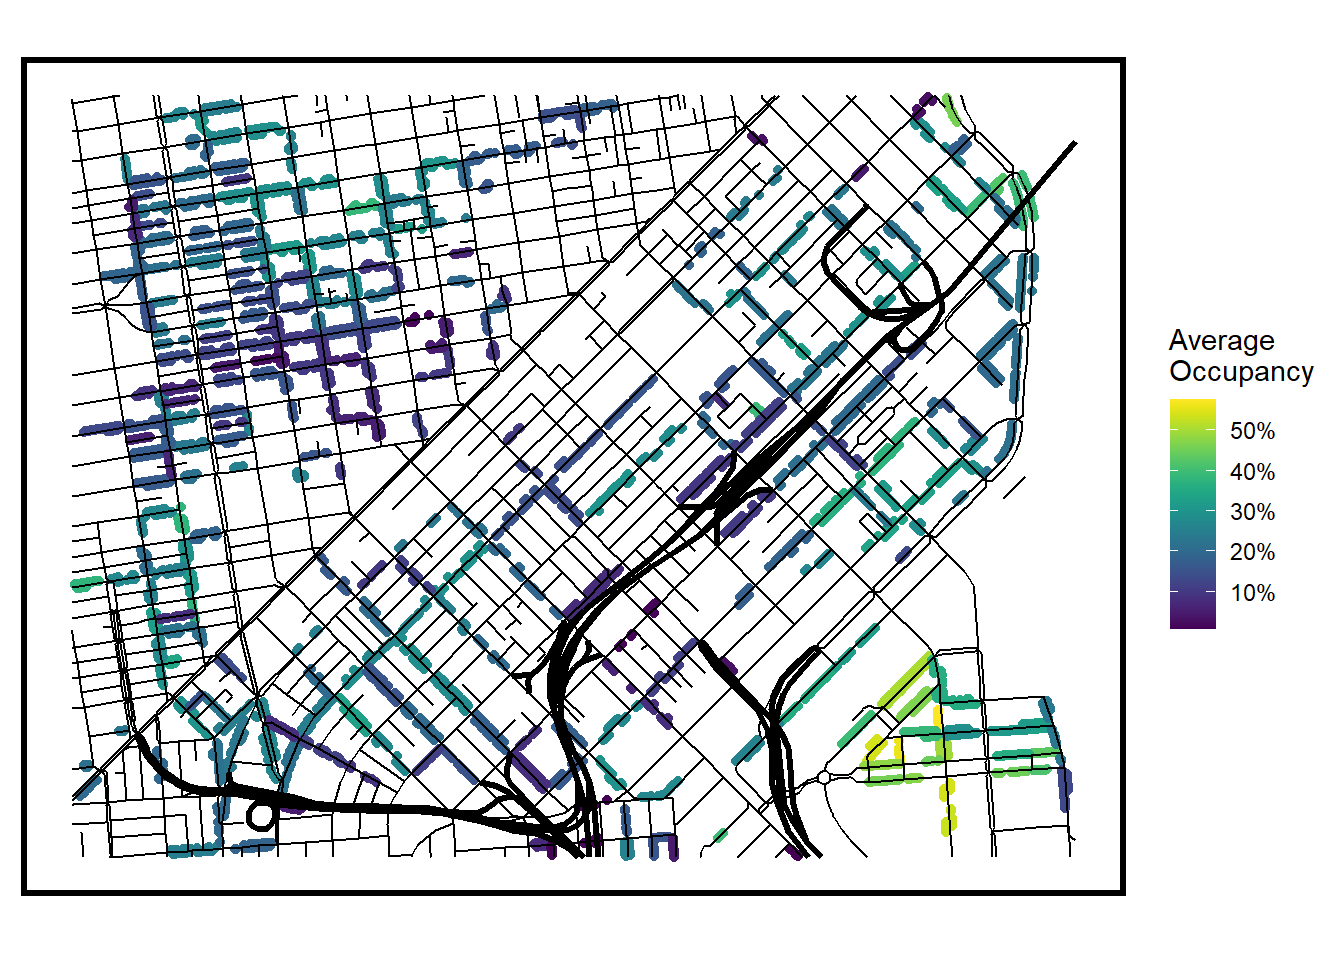
San Francisco Parking Demand Prediction
This assignment examines 5 weeks of parking meter interactions in core San Francisco with the aim of creating a fictional phone app. Parkers could use this app to find where there are free spots, and be charged a dynamic price based on the block’s expected occupancy for any given time of day, day of the week, and weather conditions.
CPLN 6750 Land Use and Environmental Modeling
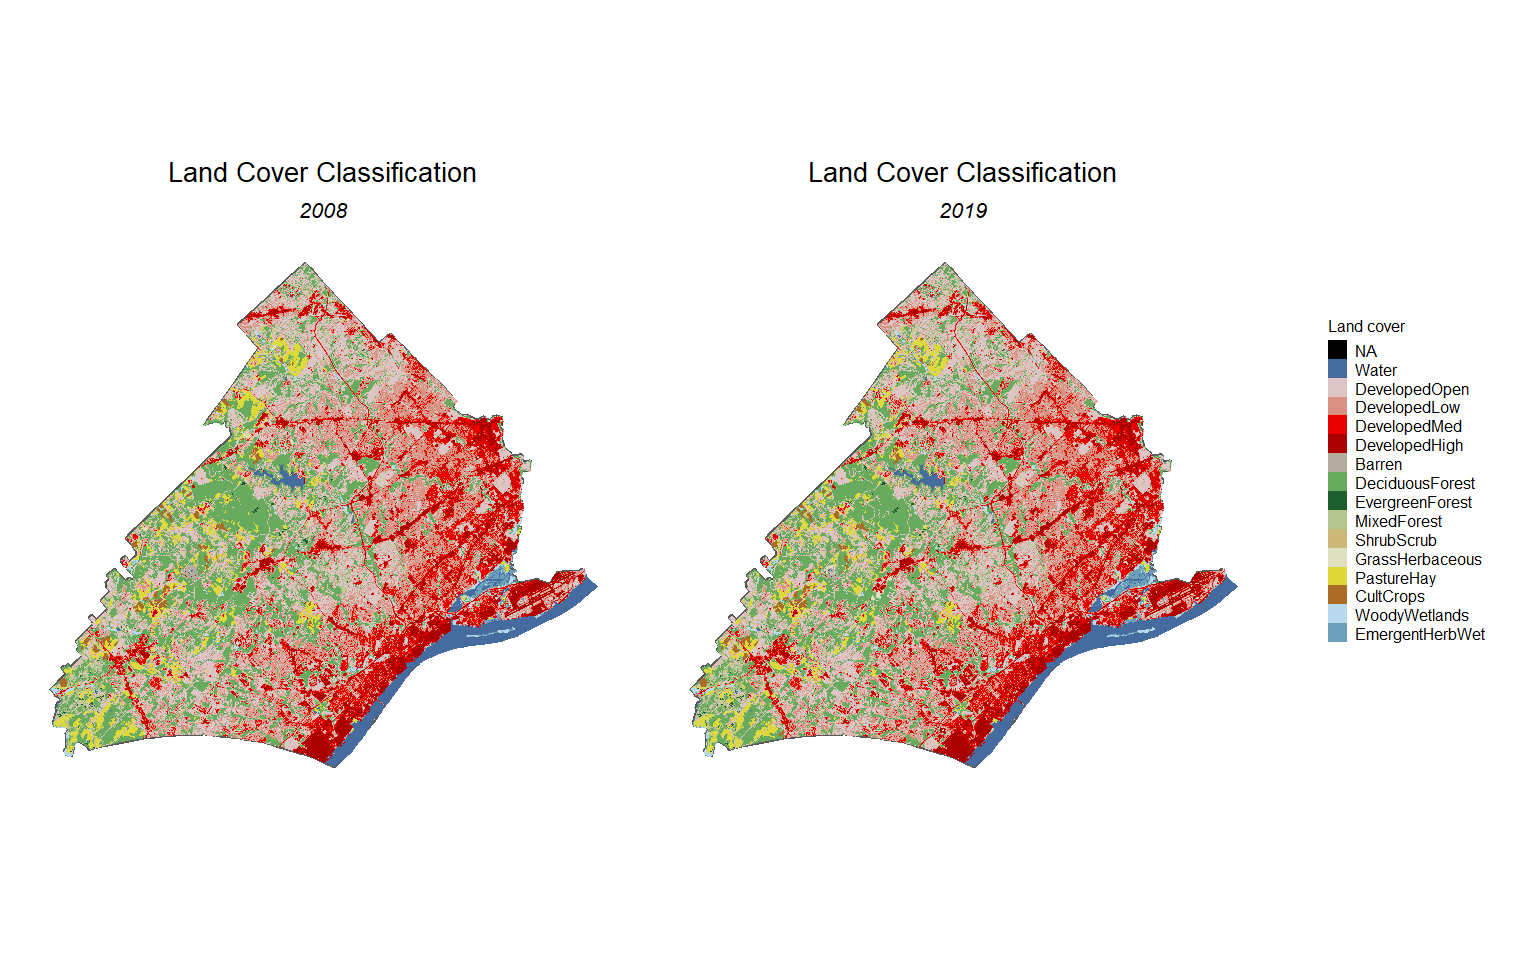
Urban Growth Modeling in Delaware County, PA
This assignment analyzes the change in land cover for Delaware County, PA, in order to predict land cover in 2030, to help guide local land use planning. We take into consideration distance to highways, SEPTA train stations, current land use, and spatial lag to development, using a logistic regression to form our final model.
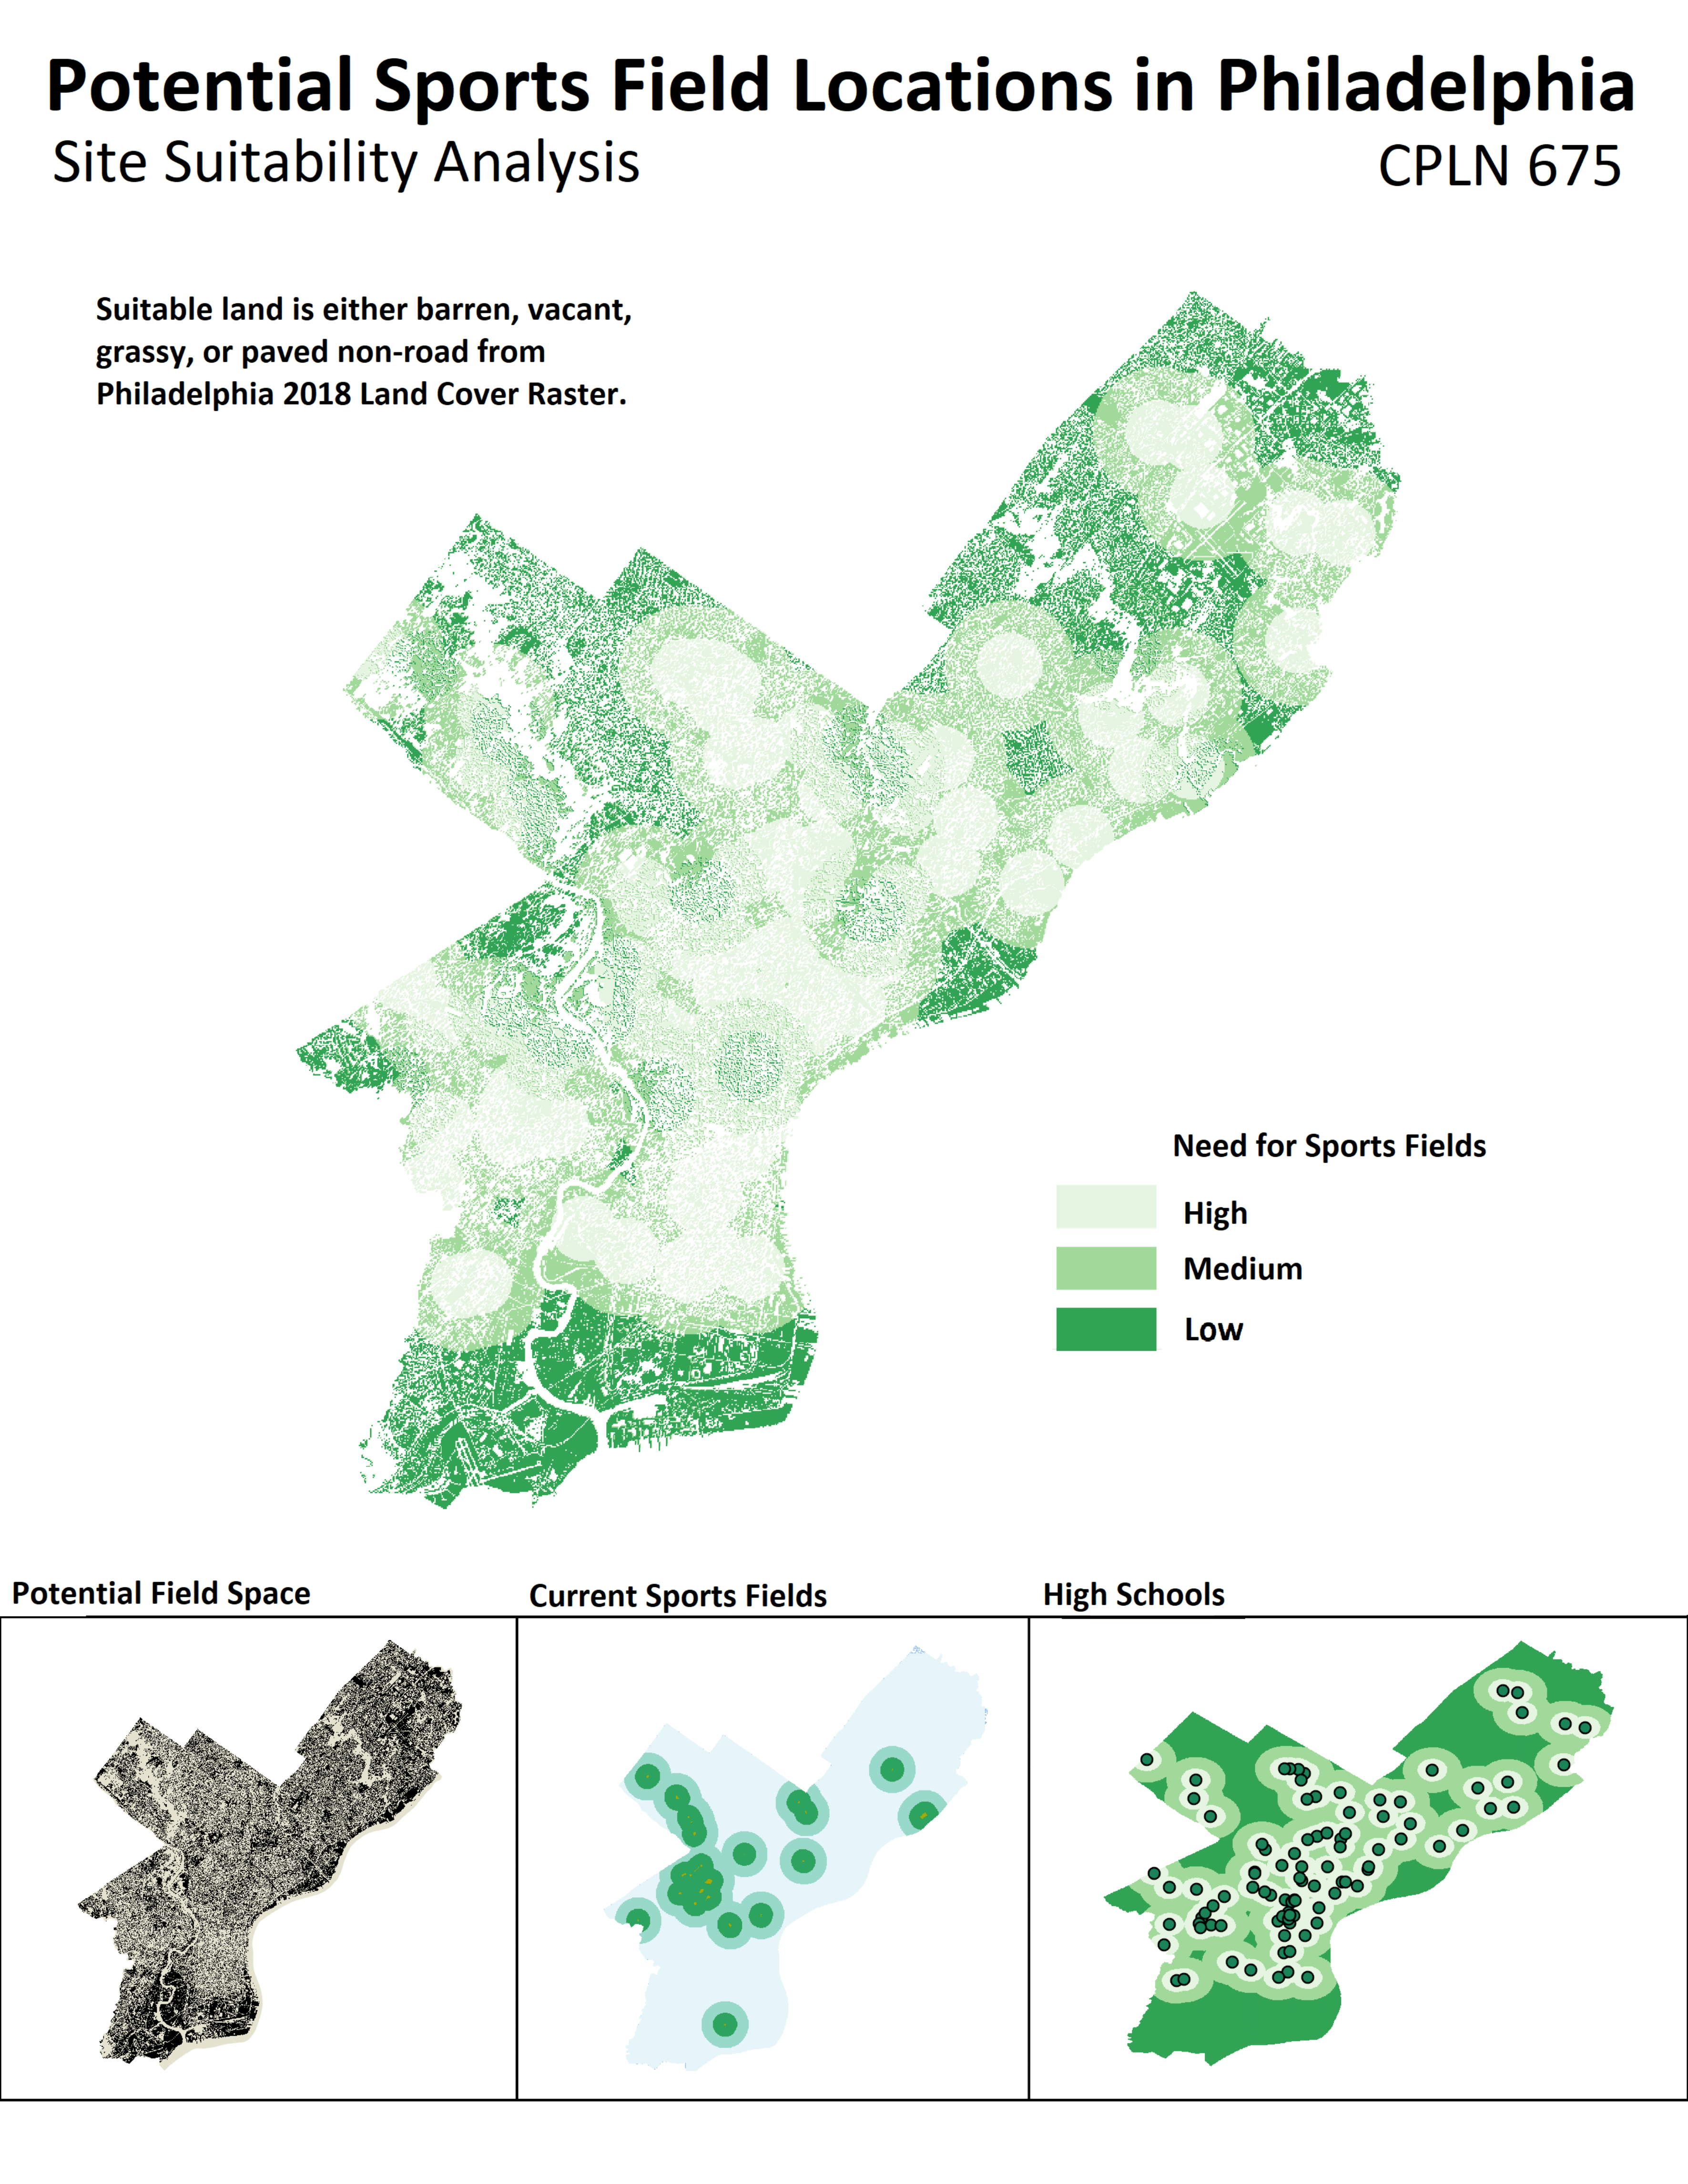
Philadelphia Sport Field Site Suitability Poster
This poster addresses the lack of sports fields for Philadelphia high school students by attempting to locate areas that would be suitable to develop for this purpose, comparing levels of need based on proximity to existing fields and proximity to high schools.
